The Kwacha Bank Analytics project is an end-to-end data analytics and business intelligence solution built on a simulated Zambian retail bank. The project models a full-service commercial bank operating 36 branches across all 10 provinces of Zambia, serving approximately 10,000 customers with a product suite spanning deposits, cards, loans, digital banking, and fraud monitoring.
The system was designed to demonstrate the complete analytics pipeline — from relational database design and synthetic data generation, through Python-based aggregation, to interactive Power BI dashboards and written business insight. It answers three core business questions:
Who are our customers, and how are they growing?
How is money moving — through which channels, accounts, and branches?
Where is the risk — in credit, fraud, and branch operations?
The dataset covers customer onboarding from 2018 to 2026, transactional activity for 2025–2026, loan disbursements for 2023–2025, and fraud alerts for 2025–2026. Total customer deposits stand at ZMW 2.03 billion, with a loan book of ZMW 290.9 million disbursed and ZMW 90.7 million outstanding.
This report and the companion README.md and insights.md files document the database, the analytical approach, the challenges encountered, and the business findings — intended to serve both as a portfolio piece and a reusable template for banking analytics.
A MySQL relational database (kwacha_bank) created from a single Python DDL script. All data is synthetically generated, modelled on realistic Zambian banking behaviour (ZMW currency, provincial geography, local branch naming conventions, and typical retail product structures).
| # | Table | Purpose |
|---|---|---|
| 1 | account_types |
Deposit product catalogue |
| 2 | loan_products |
Loan product catalogue |
| 3 | branches |
36 branches across 10 provinces |
| 4 | customers |
~10,000 retail & business customers |
| 5 | employees |
Branch staff |
| 6 | accounts |
Deposit accounts |
| 7 | cards |
Debit/credit cards |
| 8 | transactions |
Core transaction ledger |
| 9 | atm_transactions |
ATM-specific detail |
| 10 | digital_transactions |
Digital channel detail |
| 11 | loans |
Loan master records |
| 12 | loan_payments |
Repayment history |
| 13 | fraud_alerts |
Fraud detection events |
| 14 | customer_interactions |
Service & complaint log |
| 15 | monthly_customer_metrics |
Pre-aggregated monthly KPIs |
| 16 | merchants |
Merchant directory |
| 17 | salary_payments |
Salary credit records |
Indexes were created on high-cardinality foreign keys and date columns (transactions.account_id, transaction_date, customer_id, channel, loans.customer_id, loan_status, loan_payments.loan_id, payment_date, fraud_alerts.customer_id, alert_datetime, salary_payments.customer_id, payment_date) to support fast aggregation.
| Entity | Count | Value |
|---|---|---|
| Customers | 10,000 | — |
| Accounts | ~15,000 | ZMW 2.03 B current balance |
| Transactions (2025–2026) | 1,000,000 | ZMW 2.79 B |
| Loans | 5,000 | ZMW 290.9 M disbursed |
| Loan Payments | ~64,874 | ZMW 168.9 M paid |
| Fraud Alerts | 53,483 | — |
| Branches | 36 | — |
| Employees | ~470 | — |
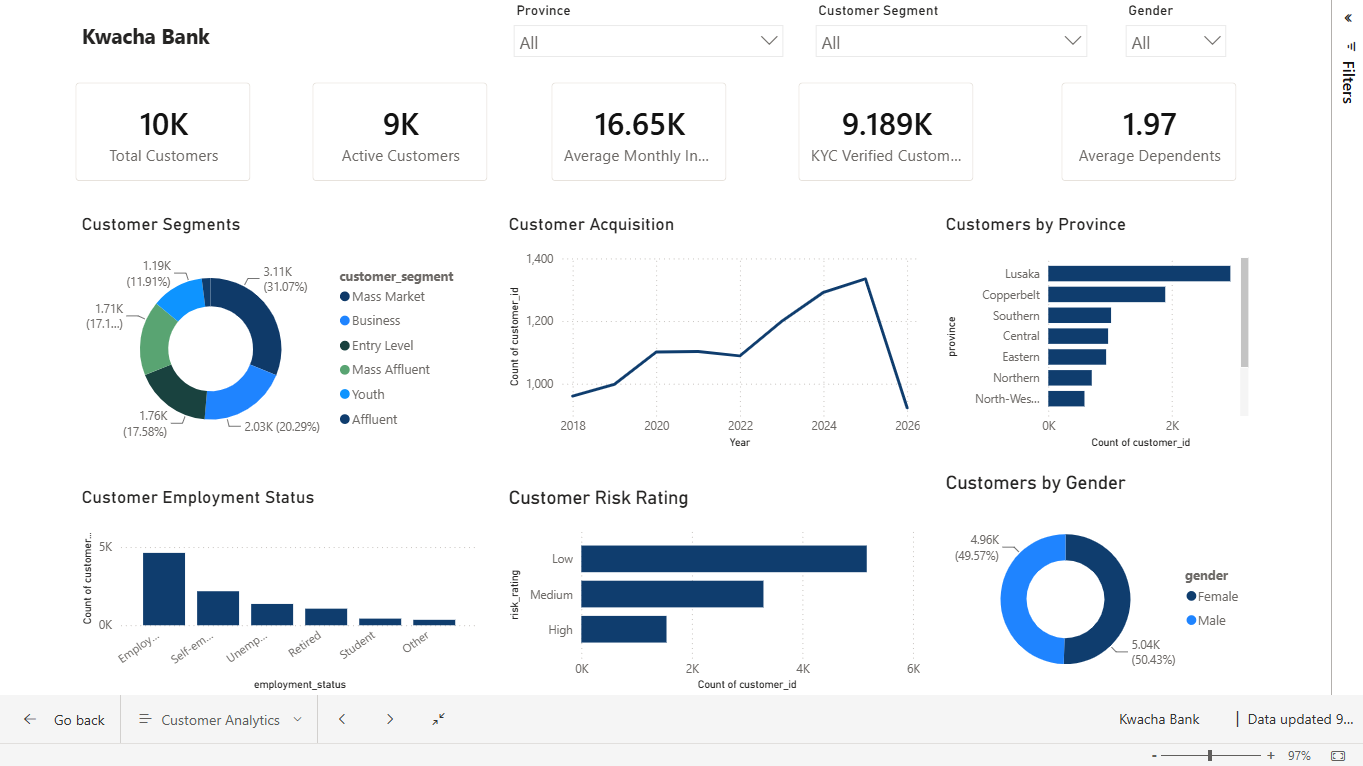
All 10 provinces represented; Lusaka and Copperbelt dominate (≈48% of customers).
Gender split is near-parity: 5,043 Female / 4,957 Male.
2026 is a partial year (through the date of extraction) and is flagged as such in all trend analysis.
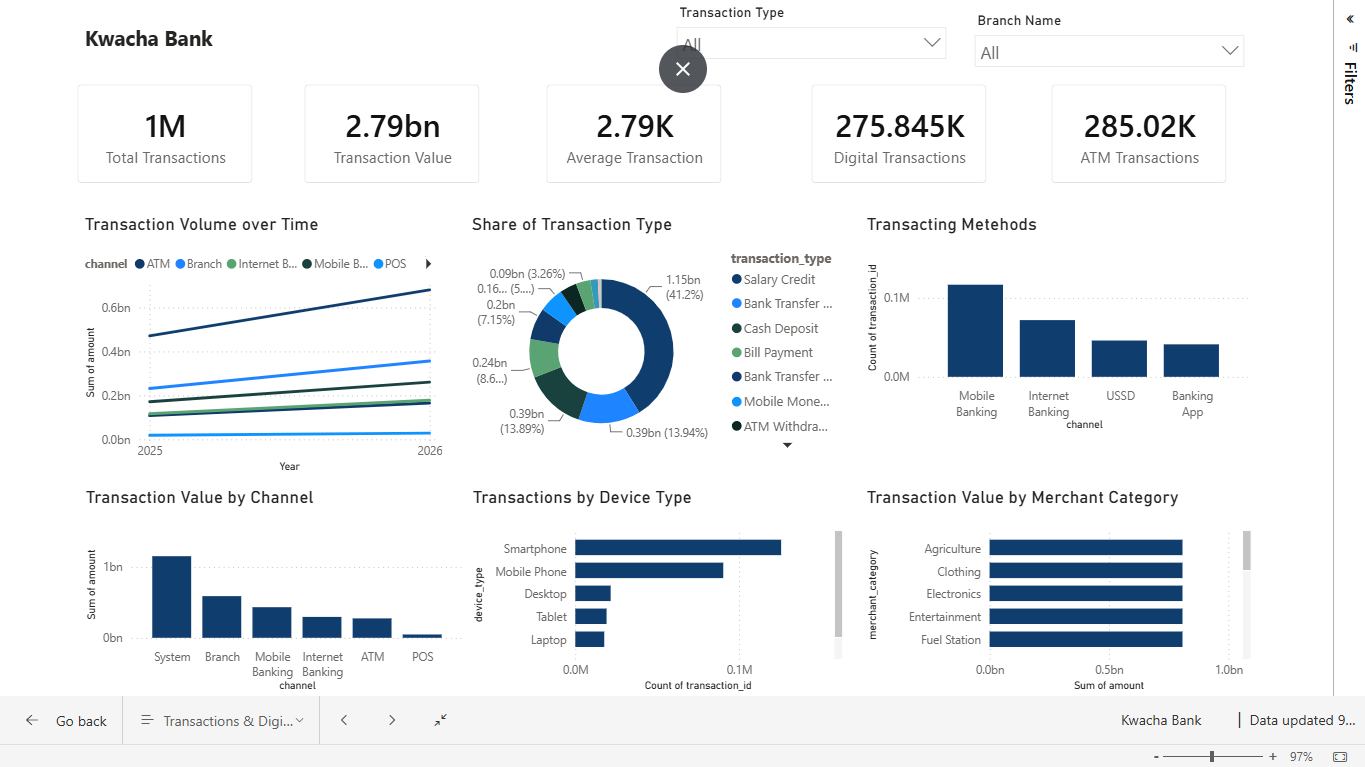
One known gap: merchants table is populated but no transaction.merchant_id values match, so merchant-category analysis returns no data (see Challenges).
Several real-world data engineering challenges surfaced during the build and analysis:
The schema enforces foreign keys across 17 tables (accounts → customers, account_types, branches; transactions → accounts, customers, branches; etc.). Generating data required strict insert ordering — reference tables first (branches, account_types, loan_products), then customers, employees, then accounts, then transaction and event tables. Any re-run required idempotent inserts or truncation to avoid duplicate-key errors.
The transactions table has a merchant_id column, but generated values did not match the merchants table's primary keys. As a result, the Merchant Category visual returned (no data). This is a classic synthetic-data pitfall: independent generation of two tables that should be keyed together. The fix would be to sample merchant_id values from the merchants table during transaction generation.
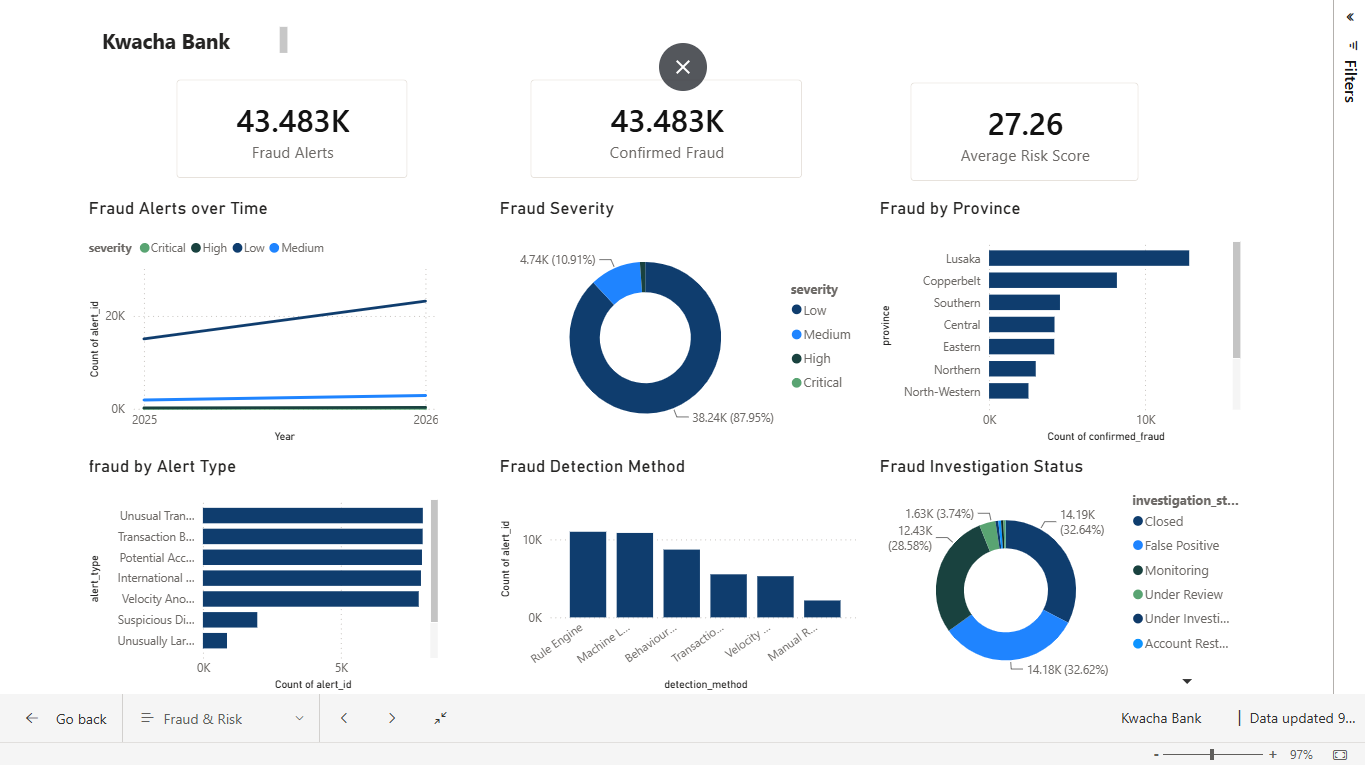
fraud_alerts stores customer_id but not province. To produce "Fraud by Province," the query had to join through customers.province — an extra hop that is fine at 53K rows but would need a materialised view at scale.
2026 contains only part of the year. All yearly trend lines show a visible drop for 2026 that is not a real decline — it is a data cut-off artefact. Every trend visual must label 2026 as YTD.
In fraud_alerts.investigation_status, statuses like Closed, False Positive, and Monitoring correctly have confirmed_fraud = 0. Only 5 statuses carry confirmed flags (Under Investigation, Account Restricted, Confirmed Fraud, Resolved — and a small edge case). Reading the confirmed-fraud rate requires filtering by status, not just summing the boolean.
Transactions only exist for 2025 and 2026, whereas customers span 2018–2026. Any "transaction per customer" metric across the full history would be misleading — customer lifetime value analysis is therefore restricted to the two-year transactional window.
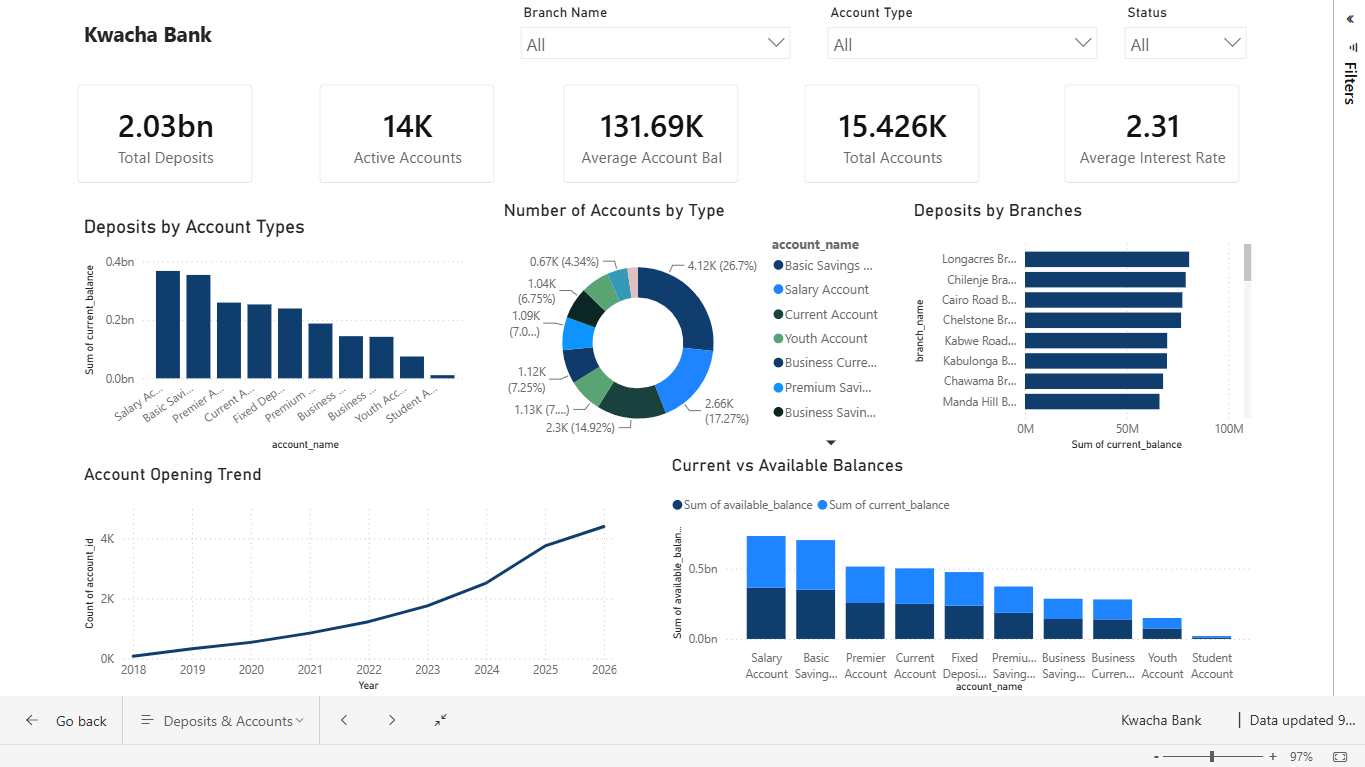
The gap between current balance (ZMW 2.031 B) and available balance (ZMW 2.009 B) is ZMW 22.1 M — representing holds, pending transactions, and overdraft utilisation. This is expected but should be explained in the dashboard so it isn't mistaken for an error.
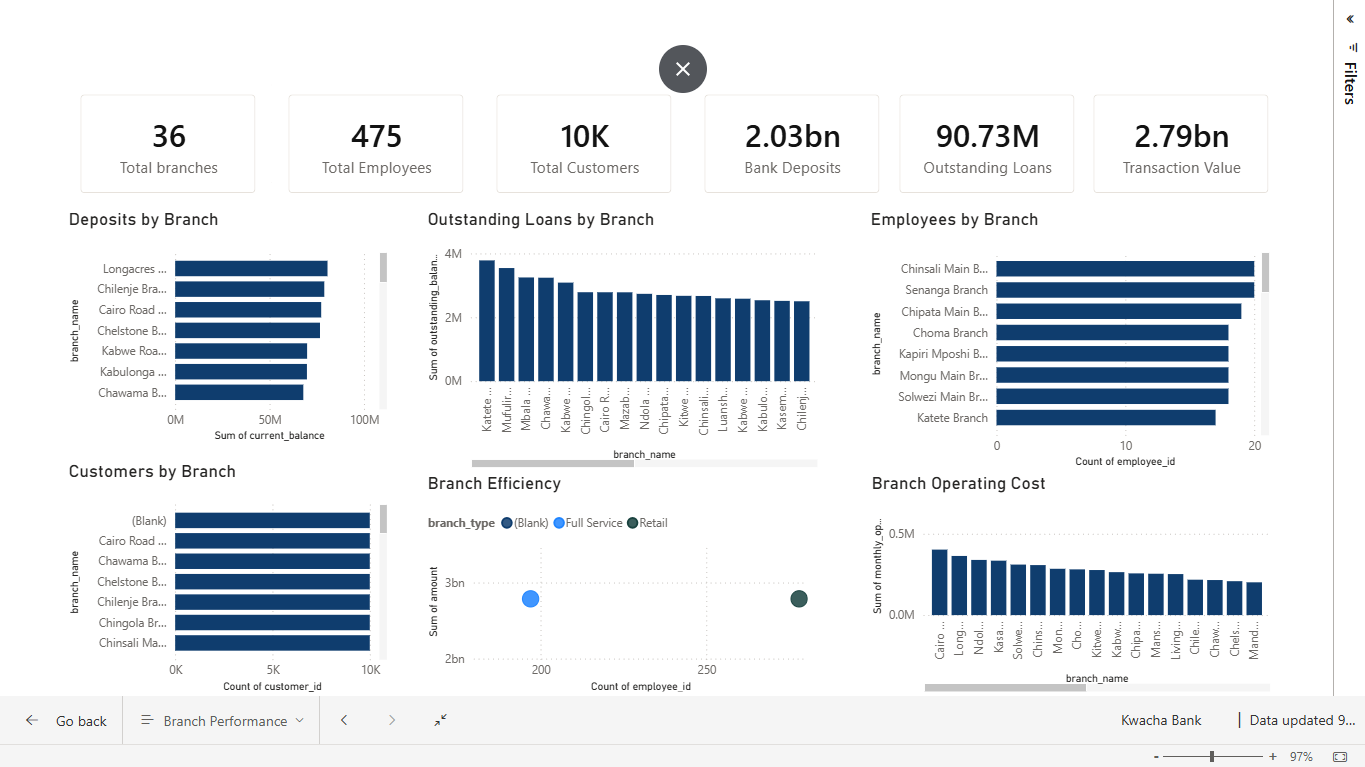
monthly_operating_cost is a monthly figure while deposits are a point-in-time stock. The efficiency ratio (deposits ÷ monthly cost) is therefore a relative ranking metric, not a true annual cost-to-income ratio. It is useful for comparison between branches but should not be quoted as an absolute efficiency percentage.
The project begins with a single Python script that connects to MySQL as root, creates the kwacha_bank database, and executes 17 CREATE TABLE IF NOT EXISTS statements plus 13 indexes. The script prints a table-by-table confirmation on success.
bash
python create_database.py
Synthetic data is inserted in dependency order: branches → account/loan products → customers → employees → accounts → cards → transactions → ATM/digital details → loans → payments → fraud alerts → interactions → monthly metrics → merchants → salary payments.
report.py)A single, self-contained Python script connects to the live database and runs 32 aggregate queries, each mapped to a specific Power BI visual. Output is plain text with a clear section header per visual, so it can be read directly from cmd and copy-pasted into documentation.
bash
cd "C:\Users\Administrator\Documents\Personal Projects\mbiile\kwacha bank"
venv\scripts\activate
python report.py
| Page | Theme | Key Visuals |
|---|---|---|
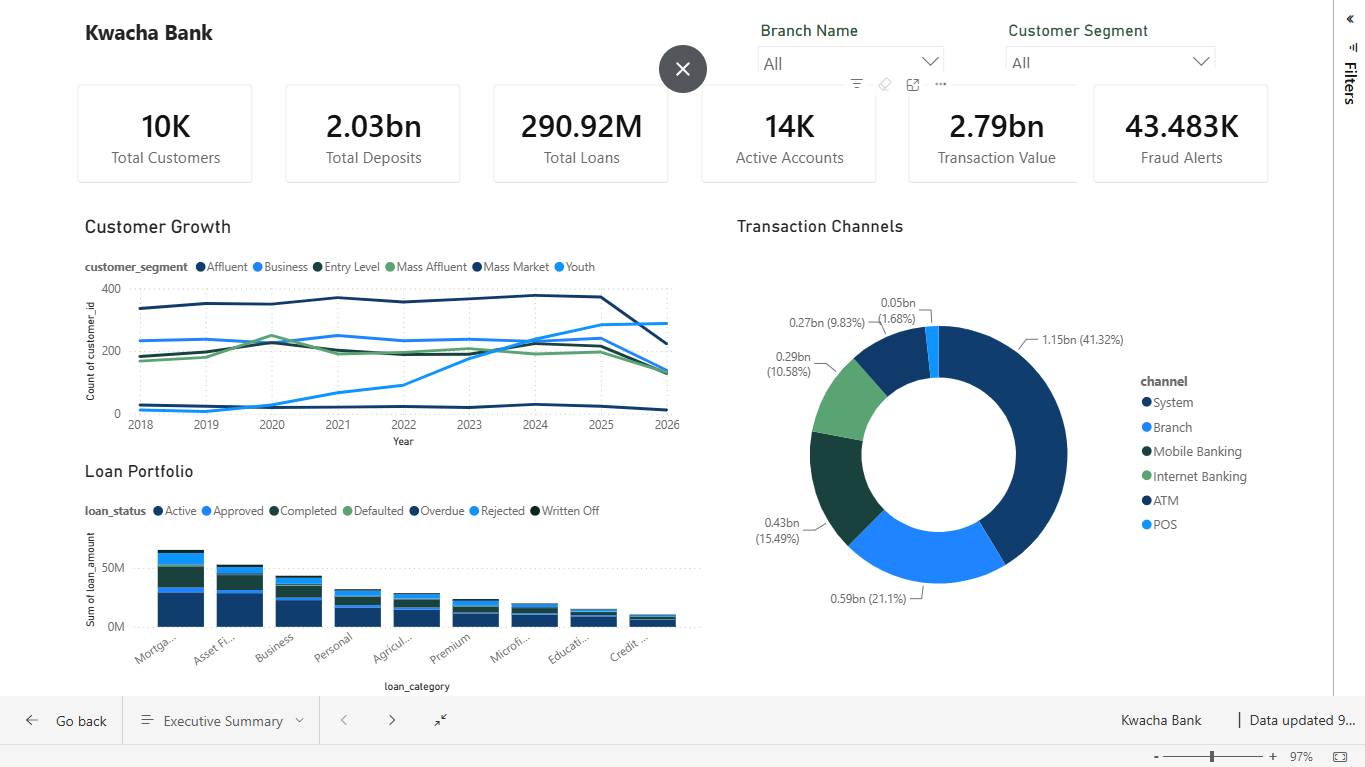
| 1 | Executive Summary | Customer growth, transaction channels, loan portfolio |
| 2 | Customer Analytics | Segments, acquisition, province, employment, risk, gender |
| 3 | Deposits & Accounts | Deposits by type, accounts by type, by branch, opening trends, current vs available |
| 5 | Transactions & Digital | Volume over time, type share, methods, value by channel, device, merchant |
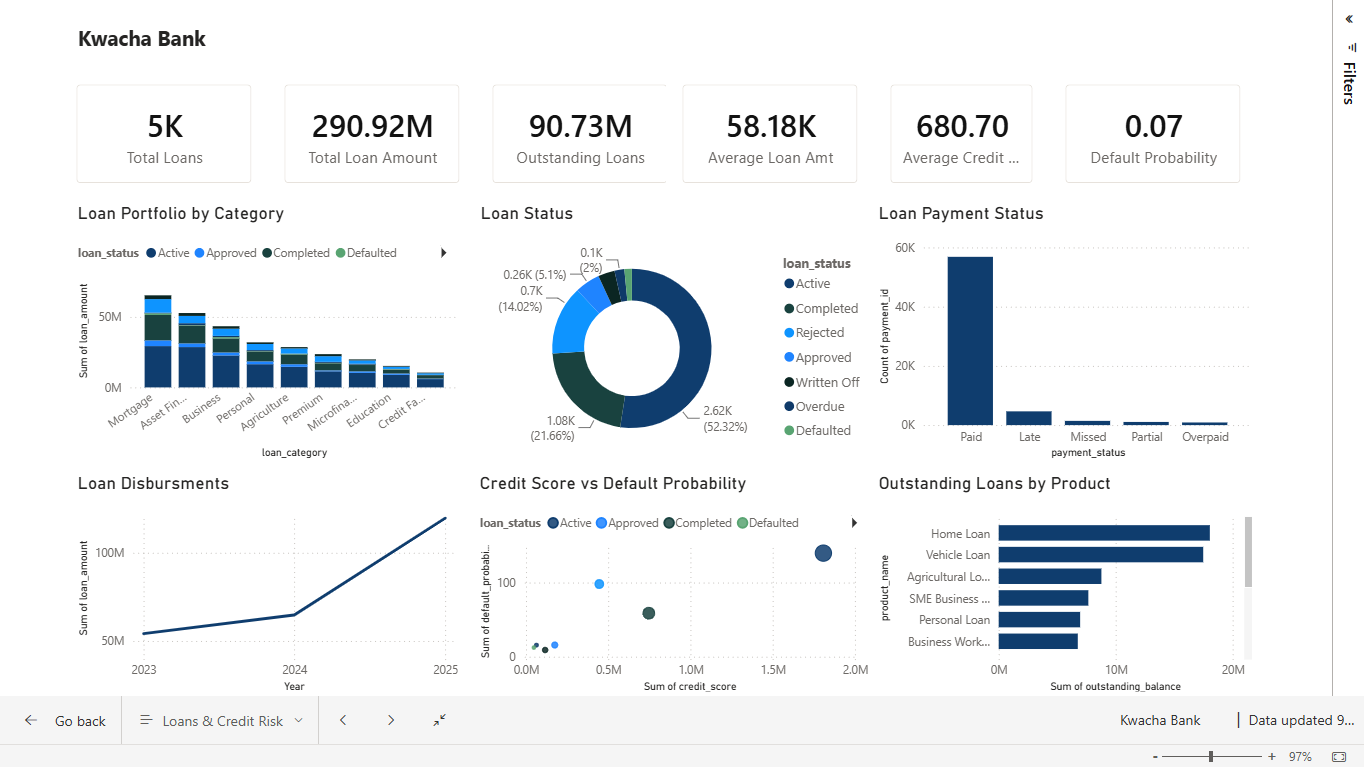
| 6 | Loans & Credit Risk | Portfolio by category, status, payment status, disbursements, credit score, outstanding by product |
| 7 | Fraud & Risk | Alerts over time, severity, province, alert type, detection method, investigation status |
| 8 | Branch Performance | Deposits, outstanding loans, employees, customers, efficiency, operating cost |
Customer base grew steadily from 960 new customers in 2018 to 1,335 in 2025 (+39%), with 2026 showing 923 YTD. Female customers (5,043) slightly outnumber male (4,957) — rare in Zambian retail banking and worth highlighting. The Mass Market segment (3,107) dominates, followed by Business (2,029).
Deposits total ZMW 2.03 B. Salary Accounts hold the largest balance (ZMW 367.5 M) despite not being the most numerous — reflecting higher average balances. Basic Savings Accounts are the most numerous (4,119) but hold ZMW 353.8 M. Account opening accelerated dramatically: 76 in 2018 → 4,399 in 2026.
Transactions in 2026 reached 605,930 (ZMW 1.67 B) vs. 394,070 (ZMW 1.12 B) in 2025 — +54% volume, +50% value. Branch is still the top channel by count (223K) and value (ZMW 588 M), but Mobile Banking is a close second (210K; ZMW 432 M). System-generated transactions carry the largest value (ZMW 1.15 B) — these are internal entries, salary credits, and automated settlements. Smartphone dominates digital device usage (125,748 transactions).
Loans total ZMW 290.9 M disbursed, ZMW 90.7 M outstanding. Mortgage (ZMW 65.3 M) and Asset Finance (ZMW 52.7 M) lead the book. Active loans (2,616) dominate, with 1,083 completed and only 76 defaulted — a healthy portfolio. Average credit score is 680.7, average default probability 6.98%. Disbursements grew from ZMW 54.1 M (2023) to ZMW 119.6 M (2025).
Fraud alerts rose from 17,113 (2025) to 26,370 (2026) — a +54% increase, mirroring transaction growth. Most alerts are Low severity (38,243), with only 12 Critical. Lusaka (12,833) and Copperbelt (8,197) account for 39% of alerts — proportional to customer concentration. Rule Engine (10,984) and Machine Learning (10,833) are the top detection methods. Critically, 14,182 alerts were False Positives and 14,191 Closed — implying a ~27% false-positive rate that represents a real operational cost.
Branch Performance: Mkushi Branch is the most efficient (686× deposits-to-monthly-cost), followed by Chingola (602×) and Kabwe Road (579×). The least efficient are Chinsali Main (72.6×), Mongu Main (93.5×), and Mansa Main (131.8×) — all high-cost, low-deposit branches that merit review. Longacres Branch holds the most deposits (ZMW 80.7 M) but is only mid-pack on efficiency due to a high operating cost (ZMW 363,515/month).
The customer base is growing but decelerating. New customer acquisition grew every year from 2018 to 2025, then moderated. 2026's 923 is a partial-year figure but still suggests acquisition is plateauing — retention and cross-sell now matter more than top-of-funnel growth.
Mobile banking has reached parity with branches. With 209,745 transactions vs. 223,232 for branches, mobile is on track to overtake branch as the primary channel. Digital investment is no longer optional.
Deposit concentration is a strength and a risk. Salary and Premier accounts hold disproportionately large balances. Losing a segment of high-balance salary customers would materially impact the deposit base.
The loan book is healthy but small relative to deposits. ZMW 90.7 M outstanding vs. ZMW 2.03 B in deposits implies a loan-to-deposit ratio of only ~4.5% — extremely conservative. There is significant headroom to grow lending.
Fraud is rising faster than the customer base. Alerts grew 54% year-on-year, outpacing both customer growth and transaction growth. A 27% false-positive rate suggests detection rules need tuning — the operational cost of investigating false alerts is real.
Branch efficiency varies 9.5× across the network. The gap between Mkushi (686×) and Chinsali (72.6×) is too wide to ignore. Low-performing branches should be reviewed for consolidation, resourcing, or product-mix changes.
Data quality issues must be fixed before scaling. The merchant-category join failure and the province gap in fraud alerts are small now but would compound as the dataset grows. Key relationship generation (transaction → merchant) must be referentially consistent.
Gender parity is a genuine differentiator. Female customers (5,043) outnumber male (4,957). Few banks in the region can claim this — it should be highlighted in marketing and product strategy.
The customer base is growing but decelerating. New customer acquisition grew every year from 2018 to 2025, then moderated. 2026's 923 is a partial-year figure but still suggests acquisition is plateauing — retention and cross-sell now matter more than top-of-funnel growth.
Mobile banking has reached parity with branches. With 209,745 transactions vs. 223,232 for branches, mobile is on track to overtake branch as the primary channel. Digital investment is no longer optional.
Deposit concentration is a strength and a risk. Salary and Premier accounts hold disproportionately large balances. Losing a segment of high-balance salary customers would materially impact the deposit base.
The loan book is healthy but small relative to deposits. ZMW 90.7 M outstanding vs. ZMW 2.03 B in deposits implies a loan-to-deposit ratio of only ~4.5% — extremely conservative. There is significant headroom to grow lending.
Fraud is rising faster than the customer base. Alerts grew 54% year-on-year, outpacing both customer growth and transaction growth. A 27% false-positive rate suggests detection rules need tuning — the operational cost of investigating false alerts is real.
Branch efficiency varies 9.5× across the network. The gap between Mkushi (686×) and Chinsali (72.6×) is too wide to ignore. Low-performing branches should be reviewed for consolidation, resourcing, or product-mix changes.
Data quality issues must be fixed before scaling. The merchant-category join failure and the province gap in fraud alerts are small now but would compound as the dataset grows. Key relationship generation (transaction → merchant) must be referentially consistent.
Gender parity is a genuine differentiator. Female customers (5,043) outnumber male (4,957). Few banks in the region can claim this — it should be highlighted in marketing and product strategy.